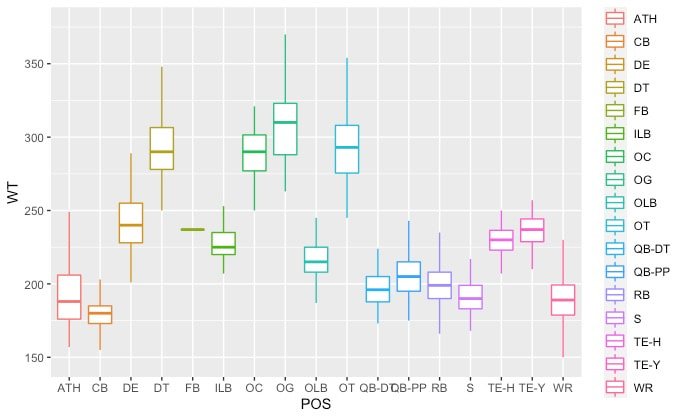
 Admittedly, I just wanted to play around with R Studio, which is a program where you can work with big data to create visuals and answer calculations. To be honest, I do most of my work in baseball, basketball and tourism, so diving into ESPN's Top 300 Football Recruits from 2013-2020 was new territory for me. What I wanted to accomplish was finding trends within the data where size influences grades. Anyone that is a 90+ (0-100 scale) is considered a 5-star prospect. In a given class you might have 10-20 of these kinds of players. I wasn't really satisfied with looking at just 5-star players, because there really wasn't enough data for me to think it was significant. Plus, it is a lot easer to get 5-star status at certain positions (i.e. offensive skill and OT and DL and CB) than at others (interior OL, LB, S). What I have below are a box-and-whisker plot looking at all positions and then supporting scatterplots for each position. In some cases I combined QB's, LB's and TE's for simplicity. What you will find are some sweet spots that are your Goldilocks "Not too big" and "Not too small" sizes for each position. At the bottom you can download my Keynote presentation in full. For the full presentation:
So over these eight years, who has signed the most ESPN Top 300 recruits? It really is no big surprise that the rich always seem to find a way to get richer. If you've watched the College Football Playoff over the last five years there really shouldn't be any surprises. 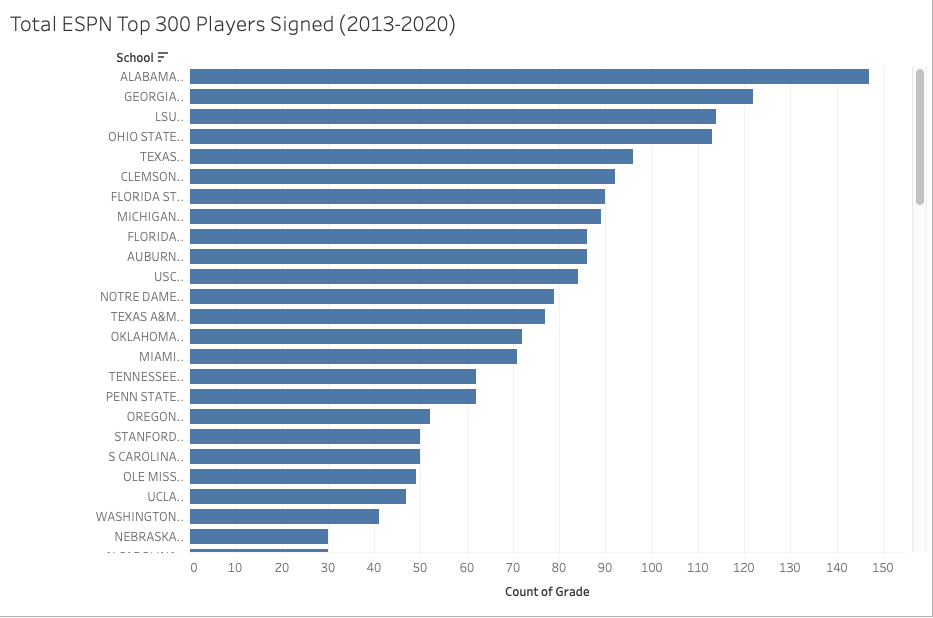
1 Comment
|
Archives
September 2020
Categories
All
About the AuthorAndy Rupert is a Penn State (B.A. John Curley Center for Sports Journalism 08') and a Southern Miss (M.S. Sport Management 09'). He has spent his whole career working in sports and tourism digital marketing and metrics. |
||
 RSS Feed
