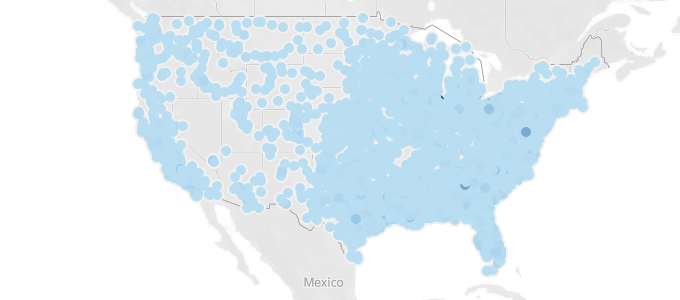
Who makes up the top 10 cities for NFL players all-time?
In this list above, which covers the entire history of the NFL according to Pro Football Reference we see a lot of traditional blue-collar northern cities and some large southern cities. How does that differ from what we see today? 
Who makes up the top 10 cities for active NFL players?
What about at the state level?
Throughout the history of the NFL you've seen a certain hierarchy of players coming from California, Texas, Florida, Ohio, Pennsylvania, Illinois and a few others. As rust belt cities have shuttered, people have retired to the south and jobs as a whole have moved below the Mason-Dixon line you've seen a shift in the concentration of NFL players.
and for active NFL players?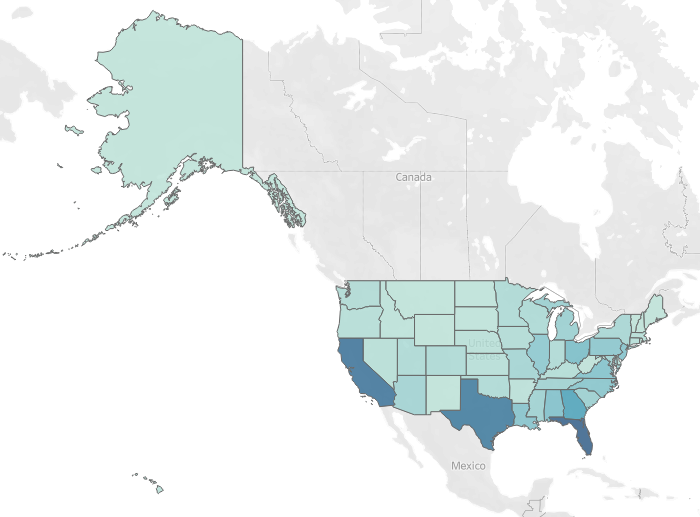
With current players you've seen Florida strengthen and the emergence of Georgia and Alabama make its way to the stage. This is great news both from a recruiting and development standpoint for the universities in those states. Not only do you have a multitude of players to choose from in your backyard, but you also can boast that you have a lineage of NFL talent and point to recent examples.
If you want to play around with the Tableau Public chart feel free. The chart that I think will interest you the most will be the last page which shows what are the top HS's for producing NFL talent in each state. I eliminated any school that has any less than 7 players from the model to keep it to a cleaner look. 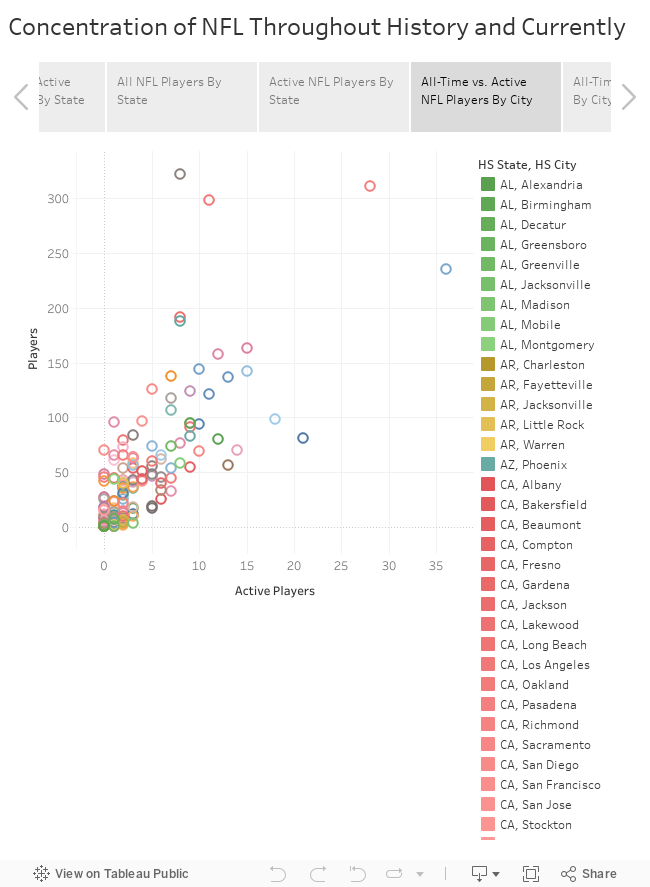
0 Comments

Overrated
The two players that came up most consistently in the overrated column for draft positions have been DeShaun Watson and Kyler Murray. Murray had a bit of the rookie blues last season with an above-average interception rate and a below-average TD rate. I would expect some improvement from the rookie QB, but not a 6th round draft choice gamble. I see a similar outlook for DeShaun Watson. Much like Murray he has the feet to get you some added yards and rushing TD's, but he also lost his top receiver in the offseason and doesn't have great numbers.
Underrated
I ran several models and the two names that came up time and time again were Kirk Cousins and Gardner Minshew. They take care of the ball, are above-average in TD's thrown and all averaged 230+ yards passing. I'll take a 4 TD to 1 INT rate any day of the week. If you're looking for a steady rate of return these might be your guys to grab late in the draft. I am talking like round 14 or later and have starter potential.

As you prepare to make your wish list for a 2020 fantasy football team let's take a look back at 2019. What do the stats tell us? I used Tableau to help tell that story.
I definitely found some surprises. To start off with I only included players with at least 50 rushing attempts to remove WR's, but I also removed QB's from the equation. I wanted strictly running backs with 50+ rushing attempts. You can thumb through the various charts below to understand what franchises gave the most touches to their RB's. Touches are defined as rushing and receiving in this example. You saw a bunch of playoff teams leading the way in running back touches. This, I am guessing, would be from leading in the game and running out the clock. The number of total yards had strong correlation with total touches, but two teams stuck out to me a bit down the line. Carolina and Cleveland turned in high yardage relative to their total touches. Of the top three touch teams (New England, Dallas and San Francisco) they take very different approaches. San Francisco seemed to rely on a distribute across a few backs, which isn't particularly optimal for drafting in fantasy while New England ran a 2-for-1 style with Sony Michel leading the way in their stable. However, Dallas leaned heavily on Zeke Elliott way more than any of the other leaders. With our outliers of Carolina and Cleveland the Panthers unsurprisingly leaned heavily on Christian McCaffrey and Cleveland with Nick Chubbs making their model more similar to Dallas. Another weird item I saw was Tennessee's high dependency on running over passing. Even though they're 15th in RB touches they are in 6th place for rushing attempts. This shows their workhorse of Derrick Henry isn't much of a factor in the passing game, nor is his backup Dion Lewis. I won't go much deeper into the data, but have fun sorting through it to find gems. 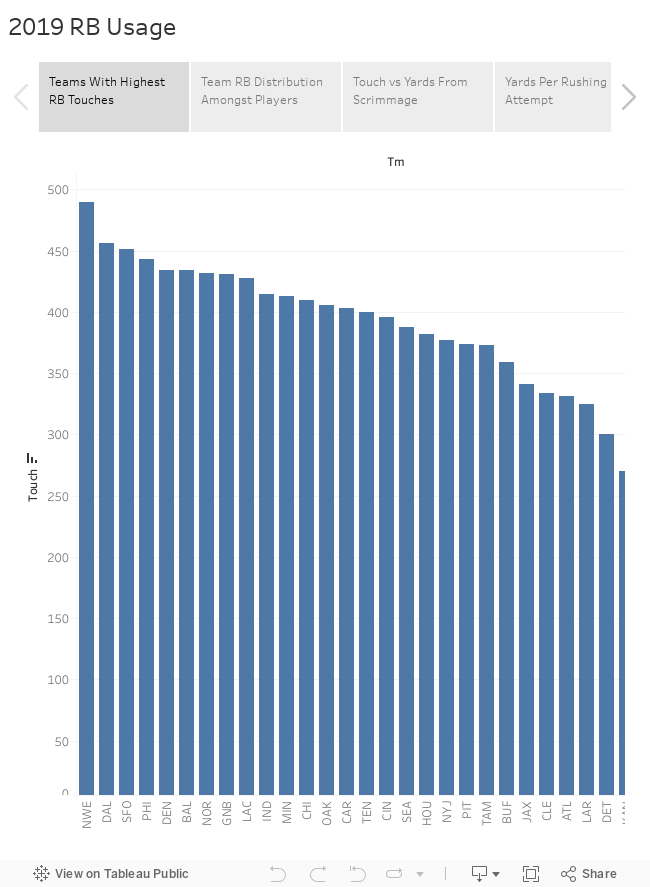
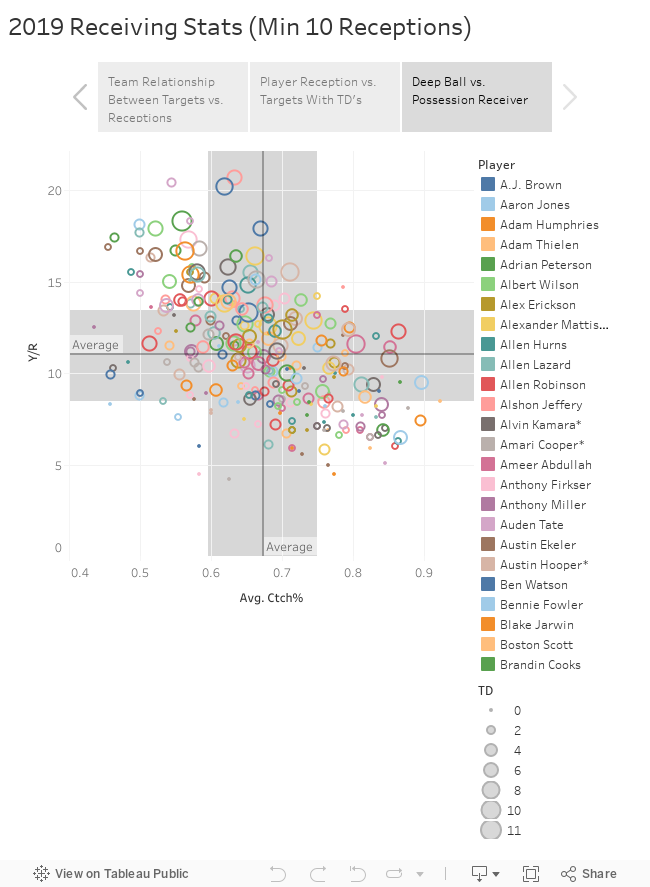
Table 1: The relationship between teams total targets for receivers with at least 10 receptions vs. the rest of the league. It is no big surprise here that the majority of dominant QB's make up the coveted top left quadrant on this model. The team that might surprise everyone is the boom-or-bust passing game of the Ravens led by Lamar Jackson. Tons of TD's on minimal targets and receptions.
Table 2: This really looks just at catch rate, where you see a pretty consistent trend line with little variance. The average is about 67.5% of balls thrown are caught by these receivers and you see that really play out in the next graph. Table 3: This is what I call your deep ball threats vs. possession receivers. The truth is you probably want to be somewhere in the top right quadrant, because you're reliable enough to go up and get balls, but you're also getting yards as part of that. The bottom right is dominated by RB's on check down and short throws such as screens. The top left is your 50/50 ball specialist who go big or go home. The bottom left is where you don't want to be as you're below average yardage and below average catch rate. 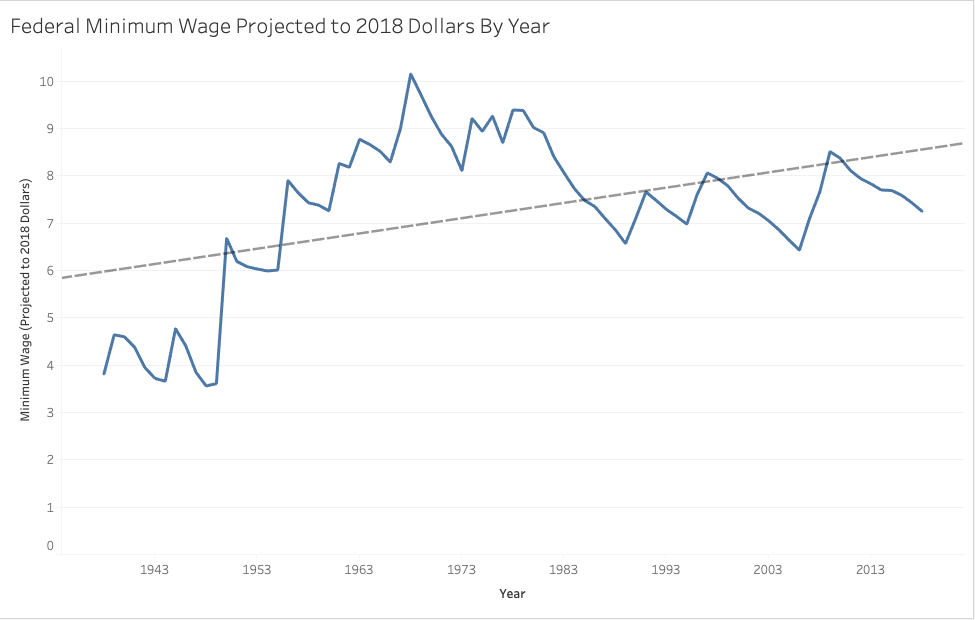 According to CNBC, in 1987 tuition at a four-year public university cost about $3,190/year in 2017 dollars. I created a chart above using Tableau to track the whole history of minimum wage since FDR's New Deal. In 1987, you could pay off your tuition on a minimum wage job in about 449 hours, before taxes. That is 8.6 hours per week. A four-year public university in 2017 costs about $9,970/year. According to the chart below it would take 1,375 hours, before taxes. That is roughly 26 hours per week. The trend line, which creates a fair historical baseline looking at the full history, says the current national minimum wage should be around $9.00. This is well below the $15 that some people are seeking, but we also do have to consider this is a national number. Midtown Manhattan isn't the same place as rural West Virginia when it comes to how far you can stretch a dollar. In fact, only three years (1997, 2009, 2010) fall above the trend line in my lifetime. If minimum wage got bumped to that it would eliminate about 200/hours of work per year for a college student trying to pay their way through. With numbers like these it is no wonder why many students opt to think long-term and pad their resume for a career rather than working a regular low-paying job. It comes down to simple risk vs. reward. To see the source of the data that I got online adjusted by year, click on the file below.
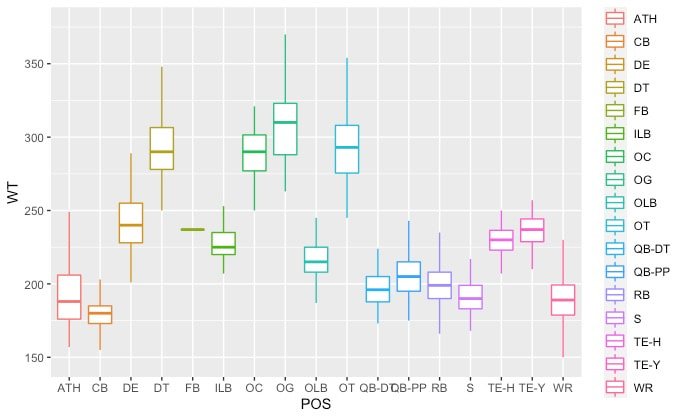 Admittedly, I just wanted to play around with R Studio, which is a program where you can work with big data to create visuals and answer calculations. To be honest, I do most of my work in baseball, basketball and tourism, so diving into ESPN's Top 300 Football Recruits from 2013-2020 was new territory for me. What I wanted to accomplish was finding trends within the data where size influences grades. Anyone that is a 90+ (0-100 scale) is considered a 5-star prospect. In a given class you might have 10-20 of these kinds of players. I wasn't really satisfied with looking at just 5-star players, because there really wasn't enough data for me to think it was significant. Plus, it is a lot easer to get 5-star status at certain positions (i.e. offensive skill and OT and DL and CB) than at others (interior OL, LB, S). What I have below are a box-and-whisker plot looking at all positions and then supporting scatterplots for each position. In some cases I combined QB's, LB's and TE's for simplicity. What you will find are some sweet spots that are your Goldilocks "Not too big" and "Not too small" sizes for each position. At the bottom you can download my Keynote presentation in full. For the full presentation:
So over these eight years, who has signed the most ESPN Top 300 recruits? It really is no big surprise that the rich always seem to find a way to get richer. If you've watched the College Football Playoff over the last five years there really shouldn't be any surprises. 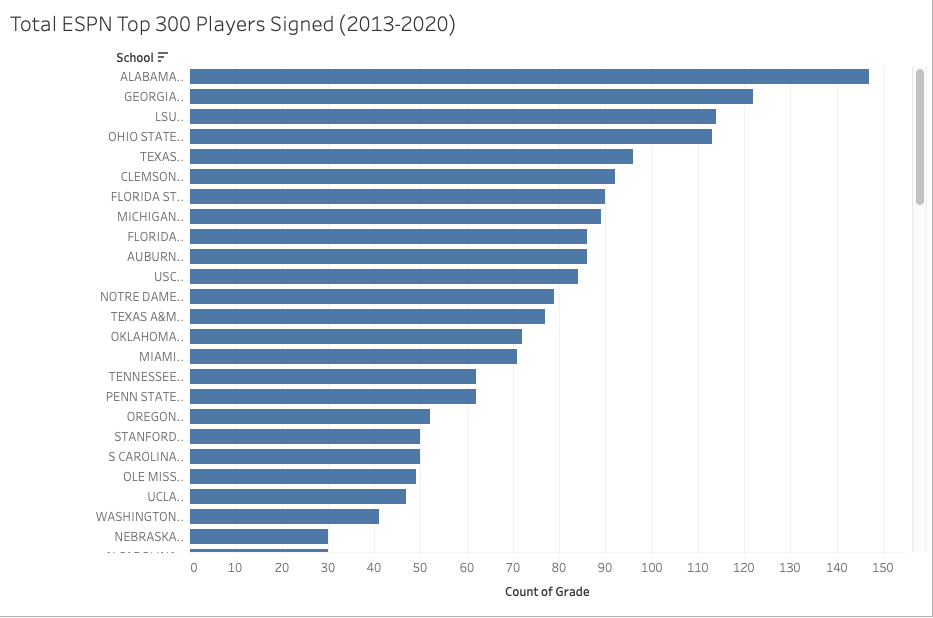 Google Trends is an absolutely wonderful big data platform. It is definitely a wormhole that can quickly turn into a time suck of an evening. For those of you unfamiliar with the platform, it basically measures the popularity of various search terms with 100 being crazy popular and 0 being virtually no one searching. The terms are also relative to the timeframe you choose and whether you compare it to any other terms. With this said, I dug a bit into what the travel world is showing using some of the more popular companies here in the States. The first company I looked at was Expedia, which is a multi-facet platform that allows you to book hotels, rental cars, flights, packages and more. Like most of the industry it was trending well until the beginning of March. Like other travel platforms they saw a huge spike the second week in March, when people started cancelling their trips and they could do so penalty free, for the most part. Expedia, like most other travel brands, bottomed out in the beginning of April and have slowly been making their way back to a somewhat normal search volume until early June. When the threat of a second wave of COVID-19 popped up in the news with cases breaking out mostly in the south and west the volume plateaued and has started creeping down. 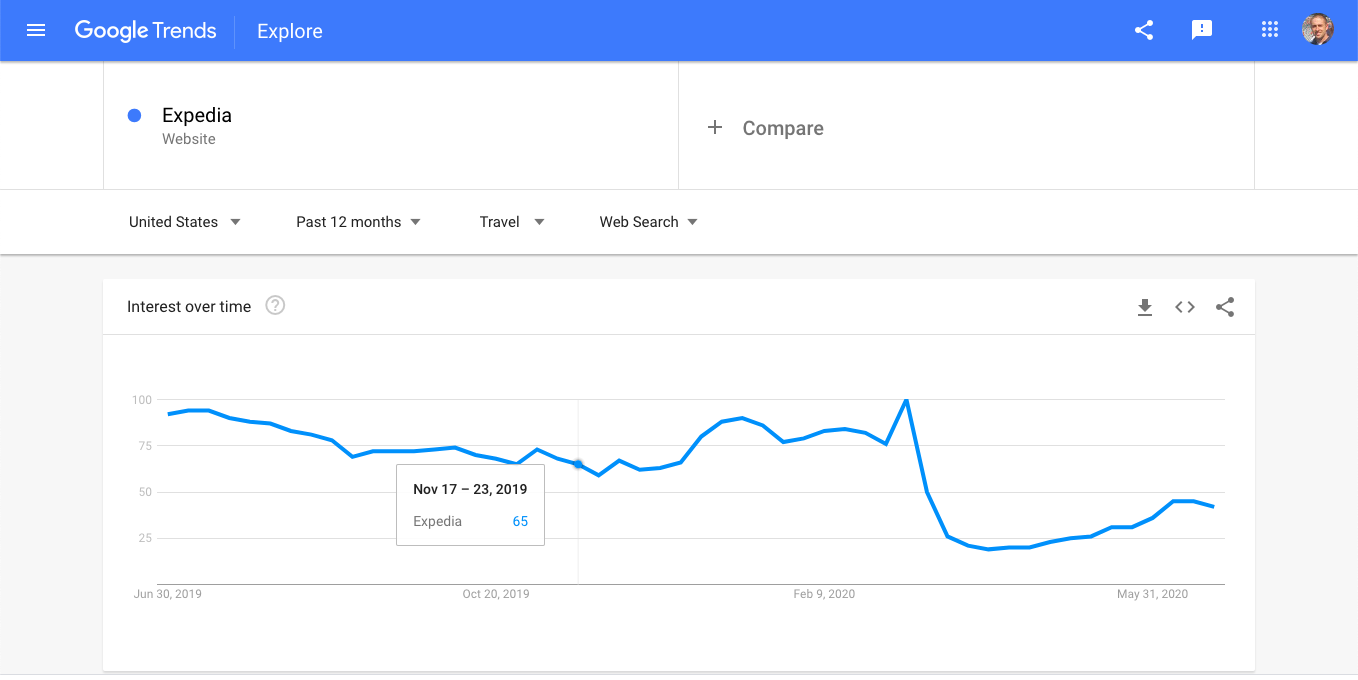 So how has this carried over to the flight market? Well, let's take a look at the cities of Philadelphia and Pittsburgh to reveal a glimmer of hope. Unlike the global brand Expedia, you've seen interest in flights to these two major cities continue to creep up. Is this mainly because Pennsylvania has done a relatively good job of slowing down COVID-19 or is it just being the least ugly girl at the dance? Pennsylvania still has its problems, but at least it isn't Florida, Texas or Arizona. The second visual is an example of Miami, FL's traffic starting to drop back down in the last couple of weeks. 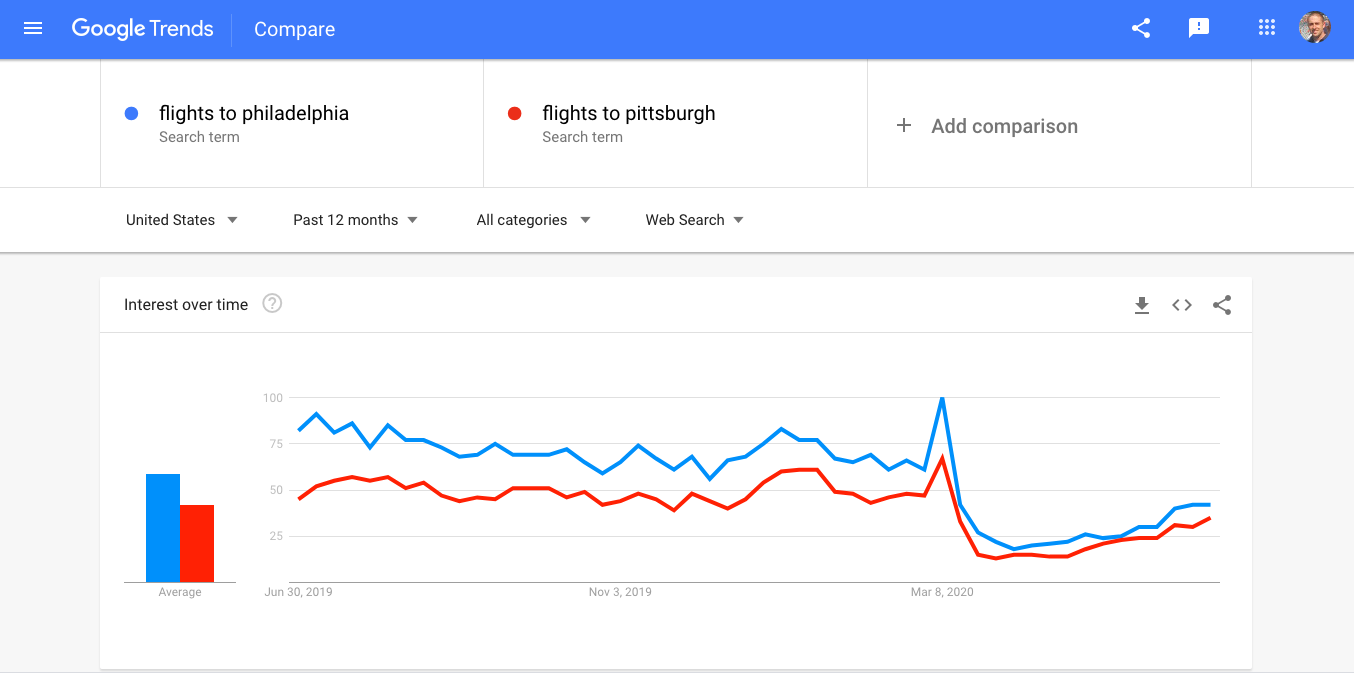 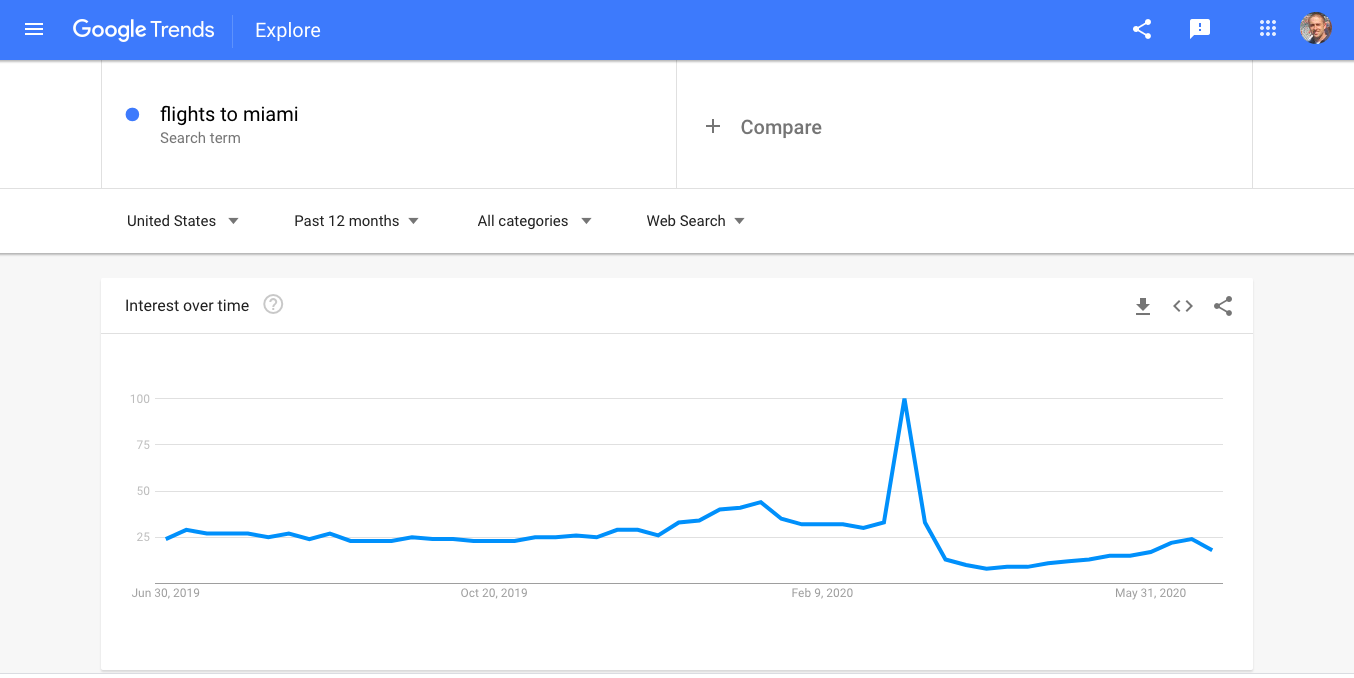 How does this compare to the airline industry as a whole? Let's take a look at Southwest Airlines (below), where we see much of its momentum has been halted in the previous couple of weeks. Even with an advertising campaign going on, the threat of disease has won out. Hopefully, they can bounce back soon. Everyone seems to be itching to travel. 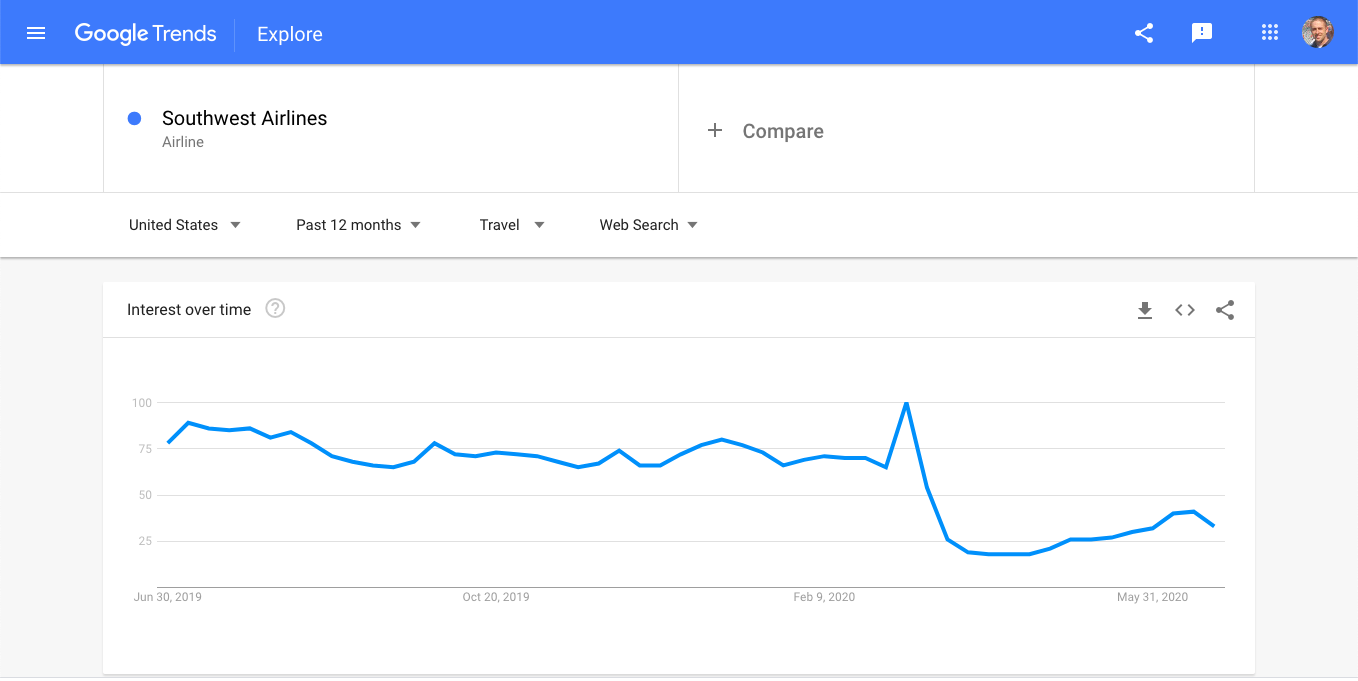 Now let's finally look at a major hotel brand in Hilton. How has that done to bounce back in a brutally down market? Hilton has a done a good job of creating momentum in a market with limited appetite for travel. However, it appears to be at a sort of fork in the road where it could stay steady and continue to creep up or tank, much like what we're seeing in Expedia and Southwest Airlines. 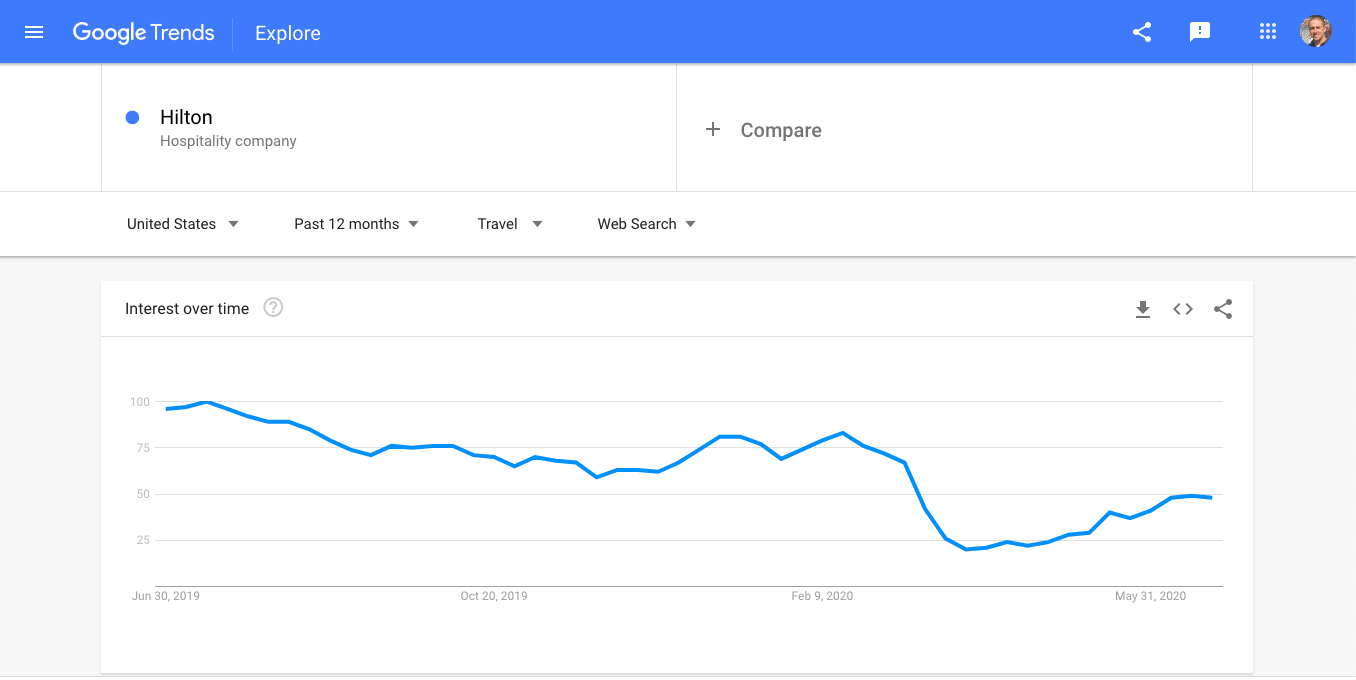 To leave you with a good taste in your mouth there has been a resurgence in the outdoors and short day trips as seen below. This is encouraging to see that people are starting to dip their toes back into the water. 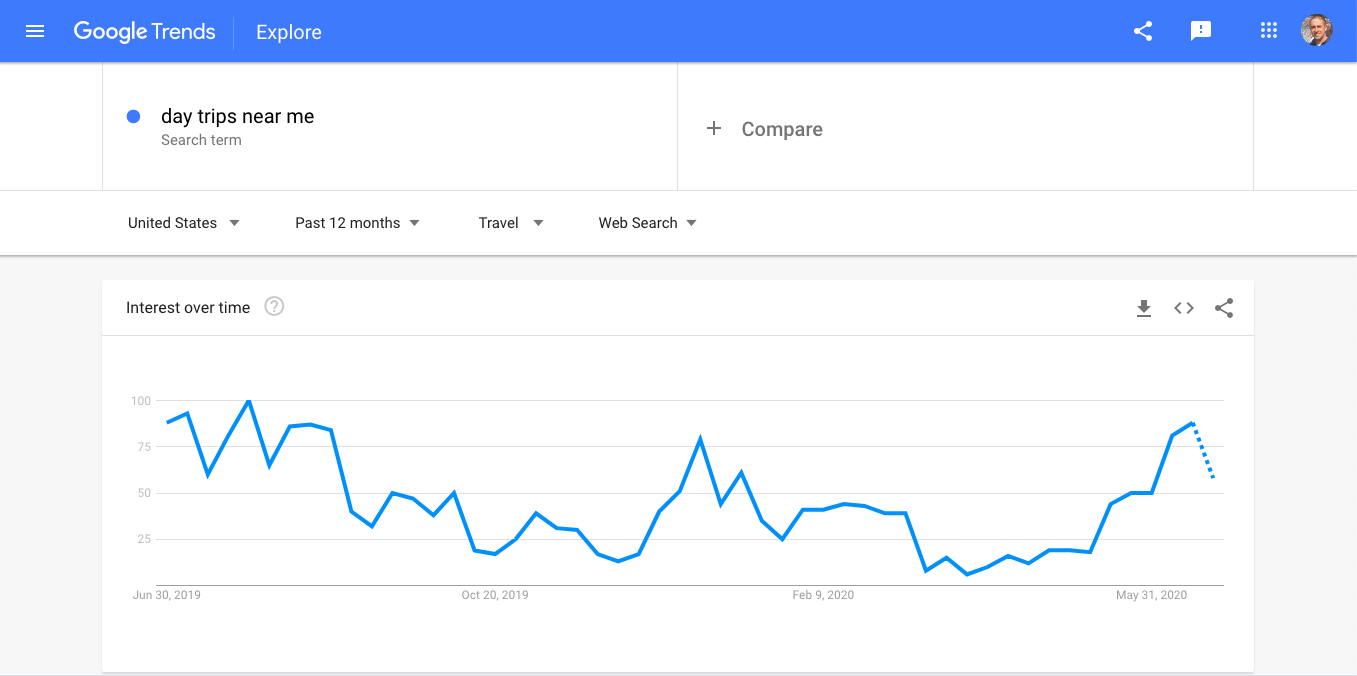 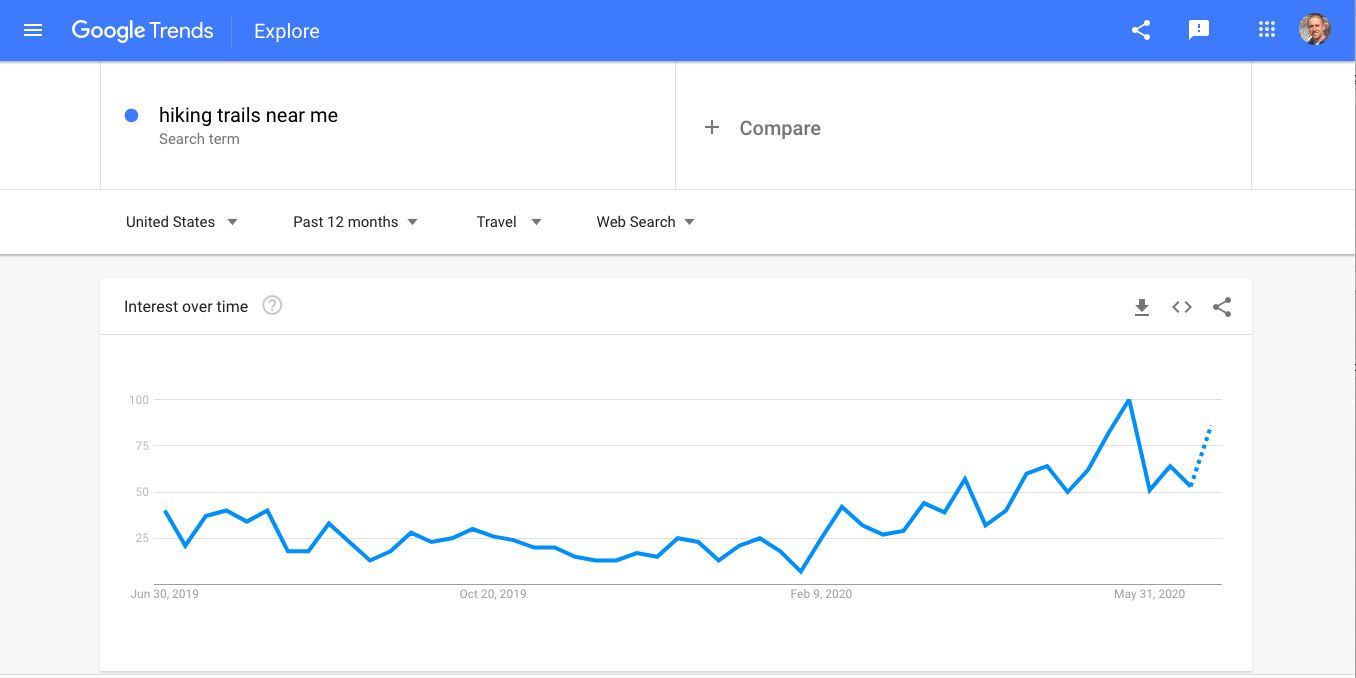 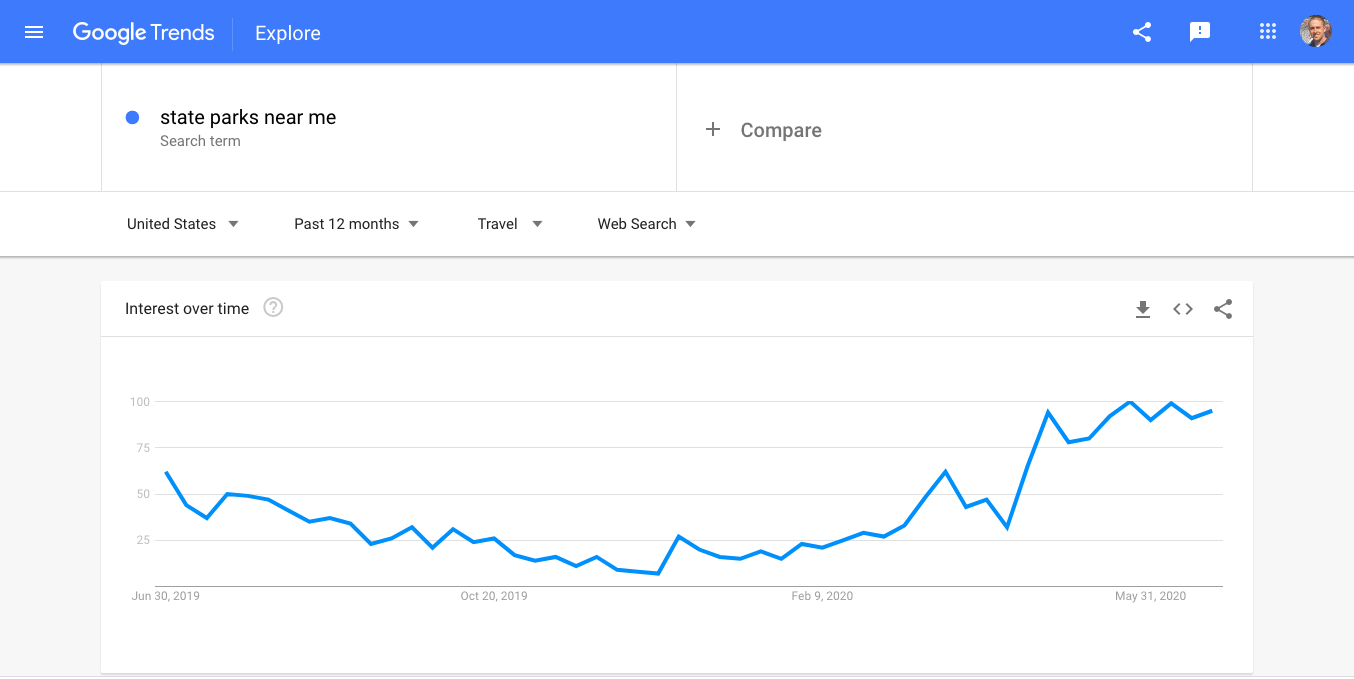  First off, I apologize for the size of the picture above. You can download it by clicking on it. Feel free to download it to scan it much closer. For those that don't want to do that I'll give you a brief on what is included. I exported the ESPN Top 300 Football Recruiting lists over the last eight finalized classes (2013-2020) to see if I could find some trends.
Recently I completed my second class in R, which is a programming language for data scientists mostly. If you're interested in taking the class here is the one I took. The software R is completely free to download, but the price you have to pay is for the online course to learn how to use the data. Now that the shameless plugs are over, let's get down to what I found. To get on ESPN's Top 300 list you have to grade out as a 80+ prospect on a scale from 0-100. At a certain point in the high-60's or low-70's ESPN basically stops even giving a number, but throws the dreaded "NR" for not rated on you. So every QB prospect on the graphic above basically tested out as a 80+ prospects. They range from 5'11" all the way to 6'7" with weights ranging from about 160-250 pounds. Needless to say this is a super wide range of sizes. The thing I found really interesting is that no QB outside of 175-225 pounds has ever gotten a rating above a 87 during this eight year window. Why is that? Is it because a QB less than 175 is either considered too slight and is moved to a position demanding more speed such as WR or CB? Is it because they're too short and can't see over the line? How about on the other end of spectrum? Is a QB prospect over 225 pounds too big and lumbering to be considered mobile enough to buy more time to find a receiver? Maybe it is just a coincidence. Long story short, there appears to be a sweet spot when it comes to weight towards getting a 5-star grade. You better be between 175-225 pounds. |
Archives
September 2020
Categories
All
About the AuthorAndy Rupert is a Penn State (B.A. John Curley Center for Sports Journalism 08') and a Southern Miss (M.S. Sport Management 09'). He has spent his whole career working in sports and tourism digital marketing and metrics. |
||||
 RSS Feed
