Table 1: The relationship between teams total targets for receivers with at least 10 receptions vs. the rest of the league. It is no big surprise here that the majority of dominant QB's make up the coveted top left quadrant on this model. The team that might surprise everyone is the boom-or-bust passing game of the Ravens led by Lamar Jackson. Tons of TD's on minimal targets and receptions.
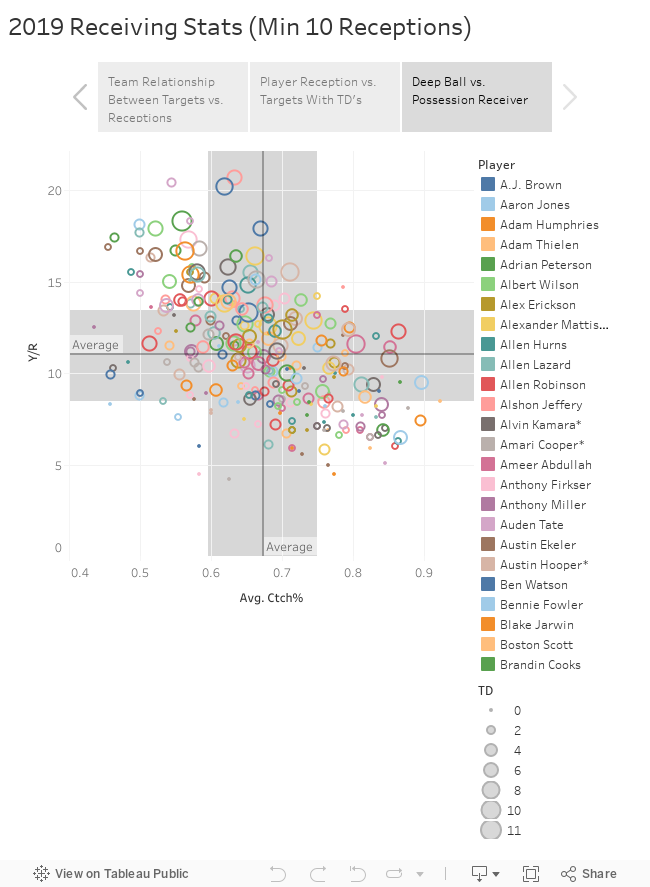
Table 2: This really looks just at catch rate, where you see a pretty consistent trend line with little variance. The average is about 67.5% of balls thrown are caught by these receivers and you see that really play out in the next graph. Table 3: This is what I call your deep ball threats vs. possession receivers. The truth is you probably want to be somewhere in the top right quadrant, because you're reliable enough to go up and get balls, but you're also getting yards as part of that. The bottom right is dominated by RB's on check down and short throws such as screens. The top left is your 50/50 ball specialist who go big or go home. The bottom left is where you don't want to be as you're below average yardage and below average catch rate.
0 Comments
Leave a Reply. |
Archives
September 2020
Categories
All
About the AuthorAndy Rupert is a Penn State (B.A. John Curley Center for Sports Journalism 08') and a Southern Miss (M.S. Sport Management 09'). He has spent his whole career working in sports and tourism digital marketing and metrics. |
 RSS Feed
